Knowledge baseDashboard and charts
The expected candle (how far this candle will go)
The grey ghost candle shows the expected high and low of the candle forming now, on every timeframe, with a live accuracy check.
With SMC on, a grey ghost candle sits behind the candle that is forming right now. It answers a simple question: how far does a candle of this coin, on this timeframe, usually go?
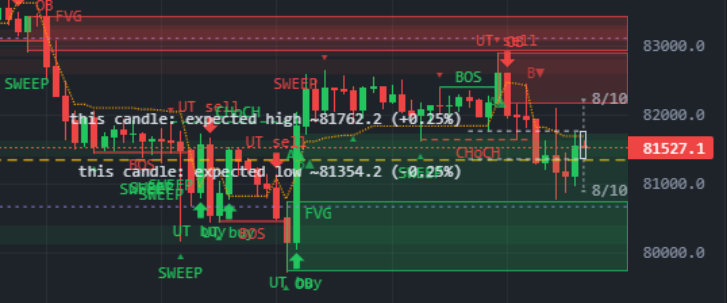
- this candle: expected high ~X / expected low ~Y - the middle of where this coin's candles usually reach, measured on its own last 500 candles of the same timeframe.
- Dotted lines with "8/10 reach" - 8 out of 10 candles stay inside them. A move beyond is unusually big for this coin.
- right N % of the last 100 - a live accuracy check on this exact chart. Around 80 % is what it should be.
The same numbers are in the This 15m candle card above the chart (the timeframe changes with the chart).
Example
BTC on 1h closes at 81,527. The card says high ~81,762 · low ~81,354. Half of the hourly candles reach about +0.29 % above the open and about −0.21 % below it; 8 in 10 stay inside the dotted ends.
How to use it
- Entries: waiting for the expected low (for a LONG) or the expected high (for a SHORT) often gives a better price than buying at once - this is exactly what the Backfill Entry algorithm does.
- Targets: a target far beyond the 8/10 reach is unlikely to be hit within one candle.
- Hide it any time with the EXP button.
It is a range, not a direction: it does not say whether the candle closes up or down.