The SMC chart layer
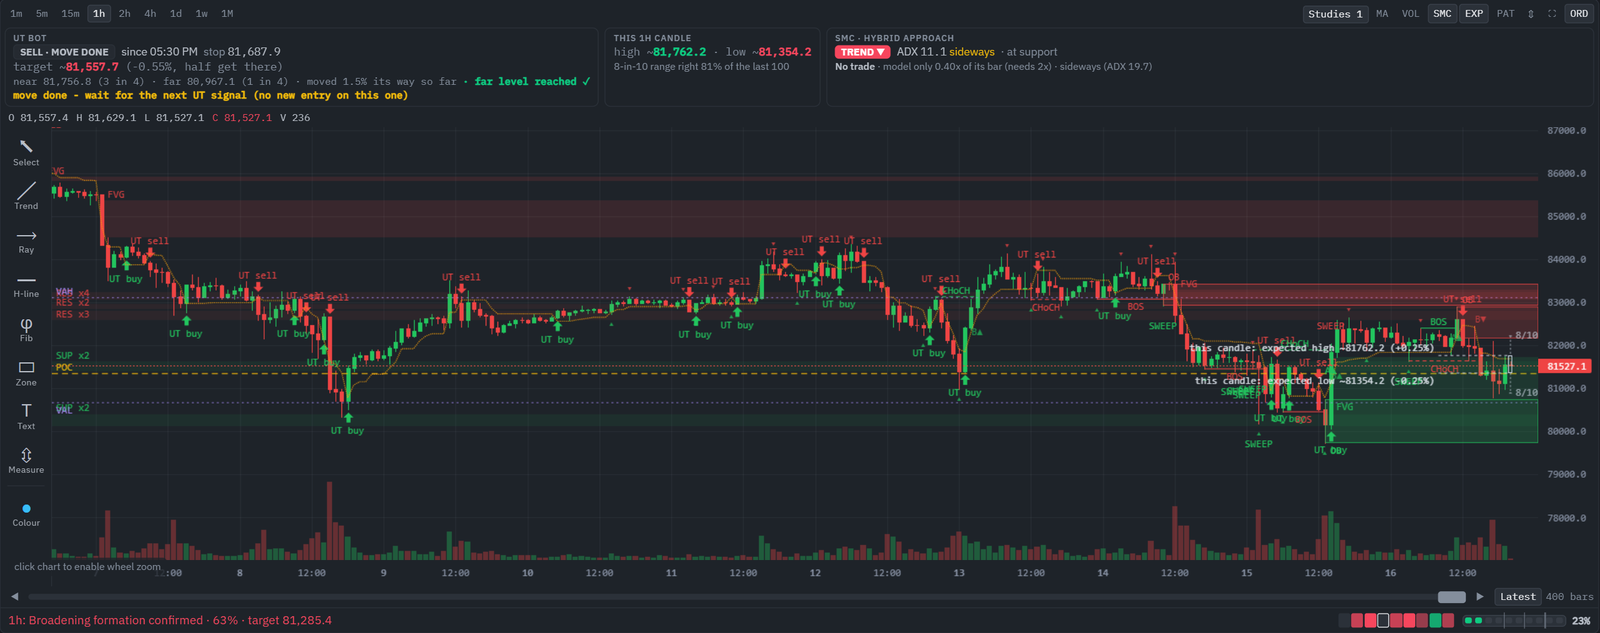
Turn on SMC to see market structure drawn on the chart - swings, BOS / CHoCH, FVG, order blocks, sweeps, support / resistance zones, volume profile and the trade plan - and read the cards above the chart.
The SMC button above every chart draws a full market-structure reading on top of the candles, the way an experienced trader would mark up a chart by hand. It works on every timeframe and updates by itself on every closed candle (and every 30 seconds) - you never need to refresh the page.
What is drawn
- Green / red bands - support (SUP) and resistance (RES) zones. The number (x2, x3 ...) says how many times price turned there.
- BOS / CHoCH lines - breaks of structure. A BOS continues the trend, a CHoCH is the first break against it.
- FVG boxes - fair value gaps left by fast moves; OB boxes - order blocks. Price often reacts when it comes back into them.
- SWEEP - a stop hunt: a wick beyond a swing that closes back inside.
- ▲ / ▼ - confirmed swing lows and highs.
- POC / VAH / VAL - dashed lines of the recent volume profile.
- The grey ghost candle on the right edge - the expected high and low of the candle forming now. See The expected candle.
Zoomed in on the live edge:
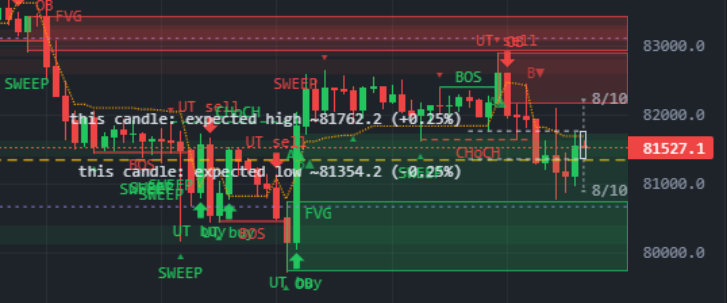
All labels are drawn above the candles, so a big candle never hides them. Every term is explained with an example in the Glossary.
The cards above the chart

| Card | Shows |
|---|---|
| Pattern | The best chart pattern on this timeframe: bullish / bearish, how far it has formed, its target, the level that would cancel it and when it is expected to complete. |
| UT Bot | The UT side, since when, its stop, target and whether the move is already done. See The UT Bot card. |
| This 15m candle | The expected high and low of the forming candle and how often that range was right lately. |
| SMC · Hybrid Approach | Trend direction, ADX (sideways or not), whether price sits on a zone - and the one trade plan the system would take now, or the short reason why there is no trade. |
On phones these cards are one row you swipe sideways, so the chart stays at the top.
The trade plan
When the conditions for a trade are met, the plan is drawn like a position tool: a white entry line, a red box down to the stop loss and a green box up to the profit lock, after which the stop trails. When there is no trade, nothing is drawn on the chart - the reason is in the SMC card.
Buttons
| Button | Effect |
|---|---|
| SMC | The whole layer on / off. |
| EXP | The expected-candle ghost and its card on / off. |
| Studies | Extra indicators, including UT Bot. |
The layer reads only closed candles. Behind the scenes the app checks every two minutes that the candles on your chart match the stored ones and repairs any gap by itself.